The chart of accounts is your financial map—it shows where every transaction belongs and keeps your records clear, consistent, and ready for reporting.
What Is a Chart of Accounts?
Cash flow statements are important because they act like a liquidity check, showing whether a business has enough cash available to pay its bills and debts on time. This is different from looking only at profit, since profit can exist “on paper” while cash is tied up in unpaid invoices or inventory. By tracking actual cash movement, managers and investors can make better decision‑making choices about whether the operations are truly sustainable.
For beginners, think of it this way:
- Operating cash flow shows money coming in from sales and going out for expenses.
- Investing cash flow shows money spent on assets like equipment or earned from selling investments.
- Financing cash flow shows money borrowed from banks or raised from investors, and repayments made.
Together, these sections reveal if the business generates enough cash to cover daily needs and plan for growth.
A strong cash flow statement also brings transparency, highlighting the difference between accounting profit (which can be adjusted by rules and timing) and actual money in the bank. Finally, it strengthens risk management by showing when a business is relying too much on external financing or one‑time inflows, which can be risky if they dry up.
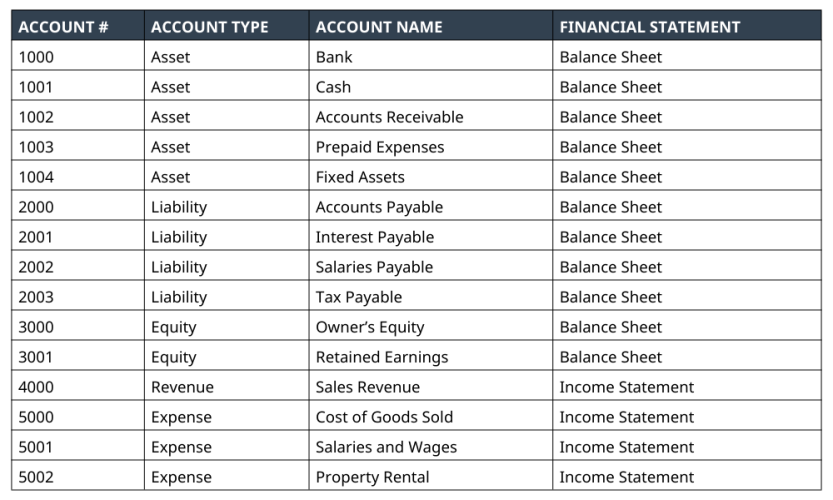
Example
This is an example shows the layout of a chart of accounts. It doesn't list every account that could possibly be on a chart account as the list can be endless. It demonstrates the columns that are required when drafting and managing a chart of accounts
Structure of a Chart of Accounts
The COA is typically divided into five major categories:
Assets
- Current assets: Cash, Accounts Receivable, Inventory
Non‑current assets: Property, Equipment, Investments
Liabilities
- Current liabilities: Accounts Payable, Short‑term Loans
Non‑current liabilities: Long‑term Debt, Lease Obligations
Equity
Owner’s Capital, Retained Earnings, Share Capital
Revenue (Income)
Sales Revenue, Service Income, Interest Income
Expenses
- Operating Expenses: Rent, Utilities, Salaries
- Non‑operating Expenses: Interest Expense, Depreciation
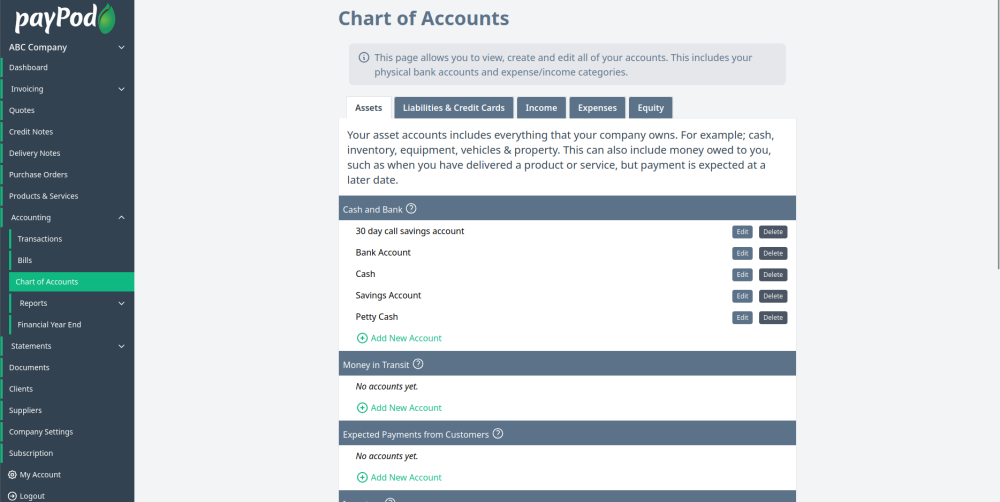
Chart of Accounts on payPod
payPod makes it easy to create accounts quickly and manage them using one simple interface with tabs for assets, liabilities & credit cards, income, expenses and equity.
Summary
- Chart of Accounts = master list of all accounts in the general ledger.
- Divided into assets, liabilities, equity, revenue, and expenses.
- Uses codes/numbers for easy classification and reporting.
- Essential for organized bookkeeping, accurate reporting, and compliance.